3 Car Stocks Are Breaking Out (They’re Not the Ones You Think!)
This article was originally published on this site
The automotive sector has been in Wall Street’s headlights in 2017 — and not for the right reasons.
From plummeting April car sales announced pretty much across the board earlier this month to Ford’s (F) high-profile decision to replace its CEO only two days ago, the automotive industry has been fraught with uncertainty lately. And as I write, auto analysts are scrambling for the whiteout, ready to revise their forecasts downward again.
So, if you’re looking for a sector to simply steer clear of this year, it’s understandable that autos are it. But while that trade might be obvious, it might be a mistake. While car stocks as a group have been barreling downhill this year, some of the individual names in the sector are actually on the verge of bullish breakout moves.
(Hint: They’re probably not the ones you think!)
To figure out which car trades are actually stomping the gas in 2017, we’re turning to the charts for a technical look at three to buy, and when to buy them.
In case you’re unfamiliar with technical analysis, here’s the executive summary: Technical analysis is a way for investors to quantify qualitative factors, such as investor psychology, based on a stock’s price action and trends. Once the domain of cloistered trading teams on Wall Street, technicals can help traders make consistently profitable trades and aid fundamental investors in better planning their stock execution.
So, without further ado, here’s a rundown of three technical setups that are showing solid trading potential right now.
Ferrari NV
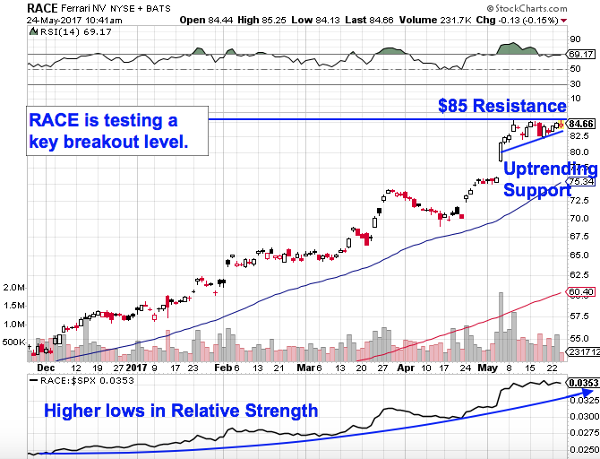
Topping our list this week is the latest major carmaker to hit the public markets: Ferrari NV (RACE) . Since its IPO, Ferrari’s share price has been leveraging its brand reputation and a red-hot global exotic car market to charge higher. Shares are up almost 37% year to date. But don’t worry if you’ve missed out on that bullish move so far; Ferrari looks primed for another leg higher.
Ferrari has spent the entire month of May forming a pretty textbook example of an ascending triangle pattern, a bullish continuation pattern that signals more upside ahead. The pattern is formed by a horizontal resistance level up above shares at $85, with uptrending support to the downside. Basically, as Ferrari bounces in between those two technically significant price levels, shares have been getting squeezed closer and closer to a breakout through $85. When that happens, we’ve got a buy signal.
Relative strength continues to make higher lows on Ferrari’s chart, indicating that this stock’s outperformance isn’t slowing as we head into the summer months. Once RACE materially cracks $85, it’s time to buy.
Toyota Motor Corp.

Most car enthusiasts will say that Ferrari and Toyota Motor Corp. (TM) don’t have much in common, but ask a trader, and you might get a different answer. That’s because, like Ferrari, Toyota is forming an ascending triangle pattern. The key difference here is that Toyota’s price setup is following a correction, not a rally. Even though that setup in Toyota isn’t textbook, it’s tradeable.
The price level to watch is resistance up at $110. The significance of that price level all boils down to buyers and sellers.
The $110 resistance level is a price where there is an excess of supply of shares; in other words, it’s a spot where sellers had previously been more eager to step in and take gains than buyers have been to buy. That’s what makes a breakout above $110 so significant — the move means that buyers are finally strong enough to absorb all of the excess supply above that price level.
For now, Toyota is still in a downtrend, but that all changes once shares are able to catch a bid above $110. Keep a close eye on shares in the sessions ahead.
Toyota Motor Corp.
Most car enthusiasts will say that Ferrari and Toyota Motor Corp. (TM) don’t have much in common, but ask a trader, and you might get a different answer. That’s because, like Ferrari, Toyota is forming an ascending triangle pattern. The key difference here is that Toyota’s price setup is following a correction, not a rally. Even though that setup in Toyota isn’t textbook, it’s tradeable.
The price level to watch is resistance up at $110. The significance of that price level all boils down to buyers and sellers.
The $110 resistance level is a price where there is an excess of supply of shares; in other words, it’s a spot where sellers had previously been more eager to step in and take gains than buyers have been to buy. That’s what makes a breakout above $110 so significant — the move means that buyers are finally strong enough to absorb all of the excess supply above that price level.
For now, Toyota is still in a downtrend, but that all changes once shares are able to catch a bid above $110. Keep a close eye on shares in the sessions ahead.