This Stock Could Rise 50% in Coming Months
This article was originally published on this site
Micron Technology Inc. (MU) caught memory bears off guard, beating quarterly earnings estimates while raising revenue and EPS guidance. The news triggered double-digit percentage gains on Wednesday morning, partially driven by short sellers forced to cover positions. It also generated analyst calls for a bullish supply cycle and higher DRAM pricing that could yield a rally into the low 30s in coming months.
The old school chip giant has been on the recovery trail since bottoming out at a 3-year low in May, but still lags the broad semiconductor sector by a wide margin. In fact, the uptick is just now reaching the midpoint of the 2014 to 2016 downtrend while the PHLX Semiconductor Index (SOX) trades a 16-year high, driven by the demand from cloud computing and mobile devices. The divergence could trigger a bullish game of catch-up, with MU surging higher to close the gap.
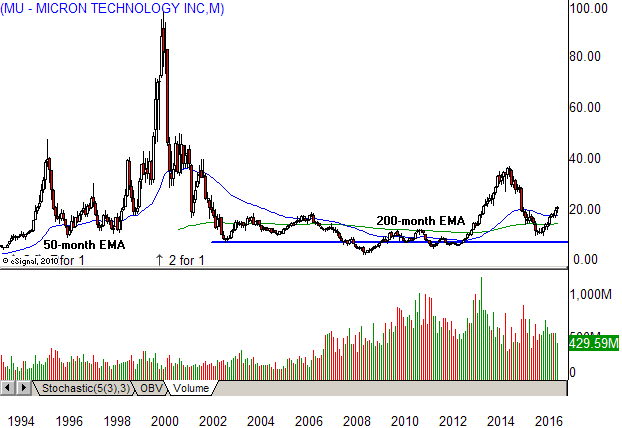
MU Long-Term Chart (1993–2016)

A multi-year basing pattern gave way to a 1993 trend advance that posted a graceful series of new highs into the 1995 peak at $47.38. The subsequent decline gave up more than 80% of the stock’s value in the next year, dropping into single digits before an equally vigorous bounce into the 20s. A 1998 test held 1996 support, generating a double bottom reversal and new uptrend that reached an all-time high at $97.50 in July 2000.
The bubble then burst, triggering a multi-wave decline that continued through the Dot.com bear market, finally coming to rest in early 2003 at a 9-year low (blue line). That level proved to be significant, triggering multiple tests over the next 13-years. A bounce into 2004 barely dented the parabolic plunge, stalling in the upper teens while a higher 2005 low set the stage for a 2006 test at resistance. That level failed to trigger a breakout, giving way to a 2007 downtrend that reached a 16-year low near one buck at the end of 2008.
The subsequent recovery wave failed to overcome broad technical damage, stalling at the .618 Fibonacci selloff retracement level in 2010. It took another three years to overcome that harmonic barrier, yielding a 2013 uptrend that ended in late 2014 just below the .386 retracement of the Dot.com decline. The stock sold off throughout 2015 and into the first half of 2016, finally bottoming out in May at a 3-year low in single digits.
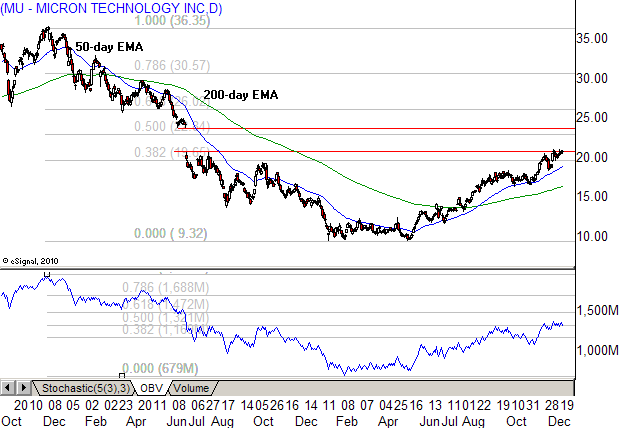
MU Short-term Chart (2014-2016)

The daily view highlights the downtrend starting in December 2014 in the mid-30s, with the June 2015 continuation gap at the 50% retracement level (red lines) organizing the broad sell pattern. The January 2016 low at $9.31 triggered a weak rally attempt while the May test undercut the prior low, before turning higher in a 2B buy signal, which denotes the failure of bears to hold a resistance level.
A channeled uptick into July lifted the stock above the 200-day EMA, with just three weeks of testing before yielding even higher prices. The rally reached resistance at the June gap in late November while this week’s earnings will trigger a gap, marking a highly bullish technical event that points to growing strength and momentum acceleration, in line with a progressive uptrend that could reach the low 30s.
On Balance Volume (OBV) supports the bullish cause, dropping in multiple distribution waves into 2016 and then posting a higher May low. The indicator lifted into the 50% retracement in October and has held that level even through price just reached its .386 retracement, setting off a minor bullish divergence that highlights bottom fishing and value hunting typical in an emerging uptrend.
The Bottom Line
Micron Technology has ground out a feast or famine price pattern in the last two decades, caught in broad cyclical action that characterizes the modern memory market. It looks like a new bull cycle is now taking hold, favoring significant upside that could add 50% or more to the stock price in 2017.


