Bullish or Bearish Market Outlook? One Chart Tells All
This article was originally published on this site
I’m going to share with you a simple way to tell at a glance the big picture, long-term outlook for the stock market. This method has been remarkably effective over the past 25 years.
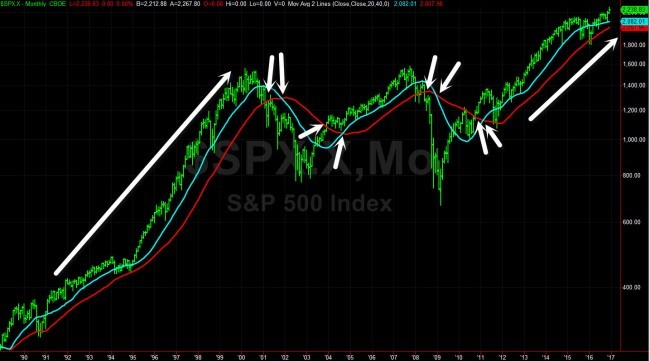
Use the S&P 500 Index ($SPX) monthly chart with 20-month and 40-month simple moving averages (MA) placed on it.
When SPX is above those moving averages and the faster 20 unit is above the slower 40 unit, the market is in Bullish mode — and vice-versa for Bearish.
Take a look at the chart below:
SPX Monthly Chart with 20- & 40-Month Moving Averages
This isn’t a system that gets you in and out of the market several times a year — it’s a broad-brush, long-term view that can be used for portfolio allocation.
For example, from 1992 to 2001, SPX remained above both of these monthly moving averages, and the faster one remained above the slower one. Therefore, the outlook remained bullish this whole time, and asset allocation would be heavily weighted to being long the stock market.
In 2001, SPX moved below its slower 40-unit moving average, and later in the year there was a bearish crossover of the MAs. Either of these are triggers for a change in the market outlook from Bullish to Bearish/Neutral/Cautious.
During those bearish time periods, one can pare down long stock allocations and put on more bearish trades and hedges.
There was a reversal back to bullish mode in 2004, another reversal back to bearish mode in 2008, and the latest move was back to bullish mode in 2011. This remains in effect currently.
The SPX 40-month moving average is 2007.96 currently; if the index closes below that, it triggers a bearish signal (as would the 20-month MA crossing below the 40-month MA).
This isn’t a short-term timing method, as I’ve mentioned. There is some slippage, due to this being based on the long-term monthly chart. In addition, of course, no market-timing model is perfect forever, every single time.
However, seeing the big picture bullish/bearish outlook is important and can give you an edge, no matter what kind of trader or investor you are.
And this simple long-term SPX chart has been on the right side of the major market moves over the past 25 years.


