4 Stocks to Ride Positive November Seasonality
November has an unmistakable allure for the Wall Street. Since 1950, it has consistently been one of the best months of the year for the S&P 500, a distinction unchallenged since 2011.
Notably, it ranks as the second-best month since 2001. The month typically commences on a strong note, marked by gains in the initial five days, before settling into a steadier rhythm leading up to Thanksgiving day.
In this article, we spotlight stocks that have demonstrated a remarkable trend over the past five Novembers by consistently outperforming the S&P 500. They tend to achieve an impressive average growth rate of over +10%, compared to the index’s +4.1%.
It’s vital to acknowledge that past performance is no guarantee of future results. To explore these stocks further, we turn to the InvestingPro tool.
1. Advanced Micro Devices
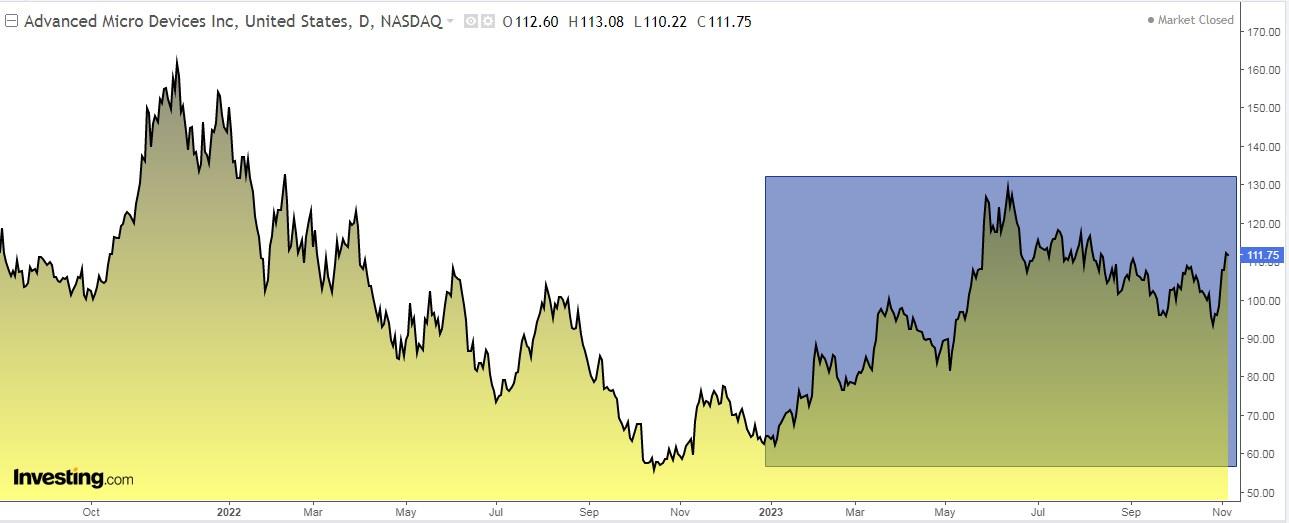
Advanced Micro Devices (NASDAQ:AMD) was founded in 1969 and is headquartered in Santa Clara, California.
It is an American semiconductor company that develops computer processors and technology products. It started out producing integrated circuits and then entered the RAM business.
The October 31 accounts were good, beating expectations for actual revenue and earnings per share (EPS). Looking ahead to 2024, revenue is expected to increase by +16.8% and EPS by +42.4%.

Source: InvestingPro
Its shares are up an average of +23.3% in the last 5 months of November.
It has 45 ratings, of which 31 are buy, 14 are hold and none are sell.
In the last year, its shares are up +77%. The market gives it a potential at $130.11.

Source: InvestingPro
2. Applied Materials
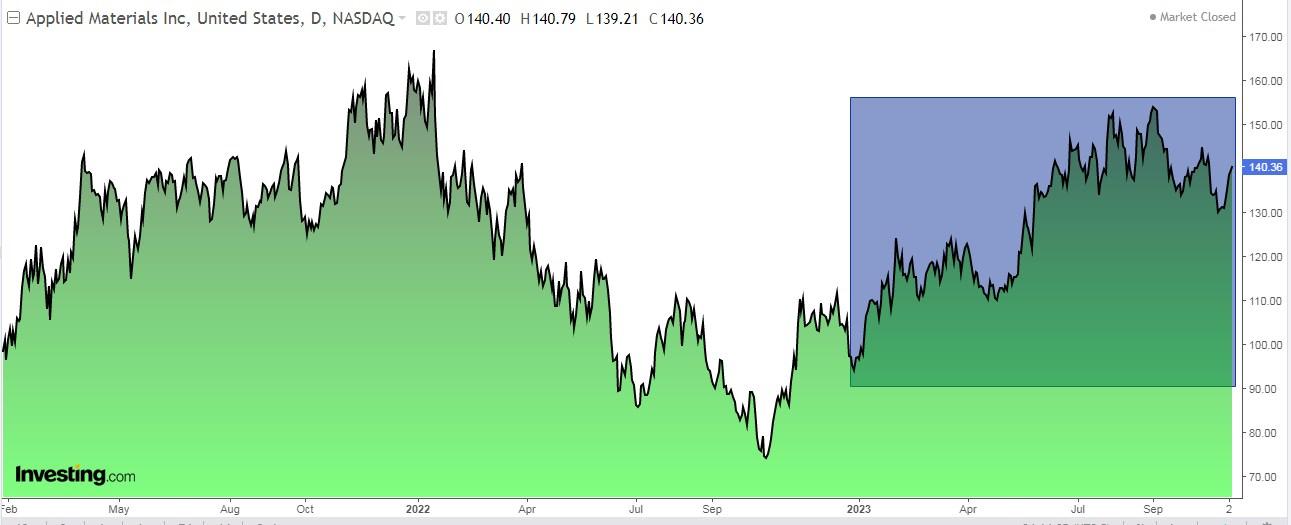
Applied Materials Inc (NASDAQ:AMAT) supplies equipment, services and software for chip manufacturing. It was incorporated in 1967 and is headquartered in Santa Clara, California.
It pays a dividend on December 14, specifically $0.32 per share, and to be eligible to receive it you must own shares before November 22.
The annual dividend yield is +0.91%. Of note, it has maintained dividend payments for 19 consecutive years, making it a potentially attractive option for dividend-focused investors.

Source: InvestingPro
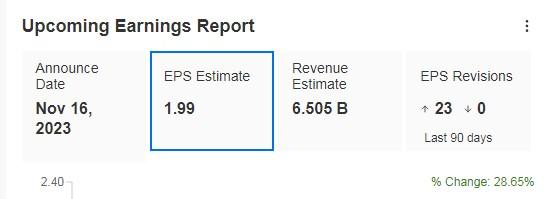
It reports its results on Nov. 16 and is expected to report real earnings growth of +15.27% and EPS growth of +28.65%.
Source: InvestingPro
Its shares are up an average of +18.2% in the last 5 months of November.
One fact that the market likes is that the company generates a high return on invested capital, which is in line with its solid return on assets. In addition, the steadily rising earnings per share suggest a strong financial performance.
Over the past year, its shares are up +49.10%. The market gives it a potential at $159.51.

Source: InvestingPro
3. On Semiconductor
ON Semiconductor’s (NASDAQ:ON) smart energy technology enables the electrification of the automotive industry, allowing for lighter and longer-range electric vehicles, powers fast charging systems, and drives sustainable energy for solar strings. It was created in 1992 and is based in Scottsdale, Arizona.
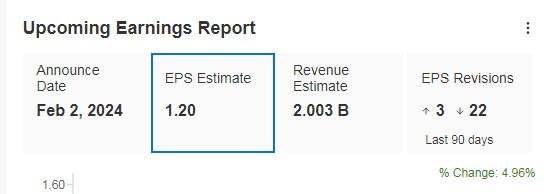
It will report its results on February 2 and the market expects an EPS increase of +4.96%.
Source: InvestingPro
Its shares are up an average of +16.6% in the last 5 months of November.
In the last year, its shares are up +1.40%. The market gives it a potential at $88.15, while InvestingPro models put it at $86.38.

Source: InvestingPro
4. Bath & Body Works
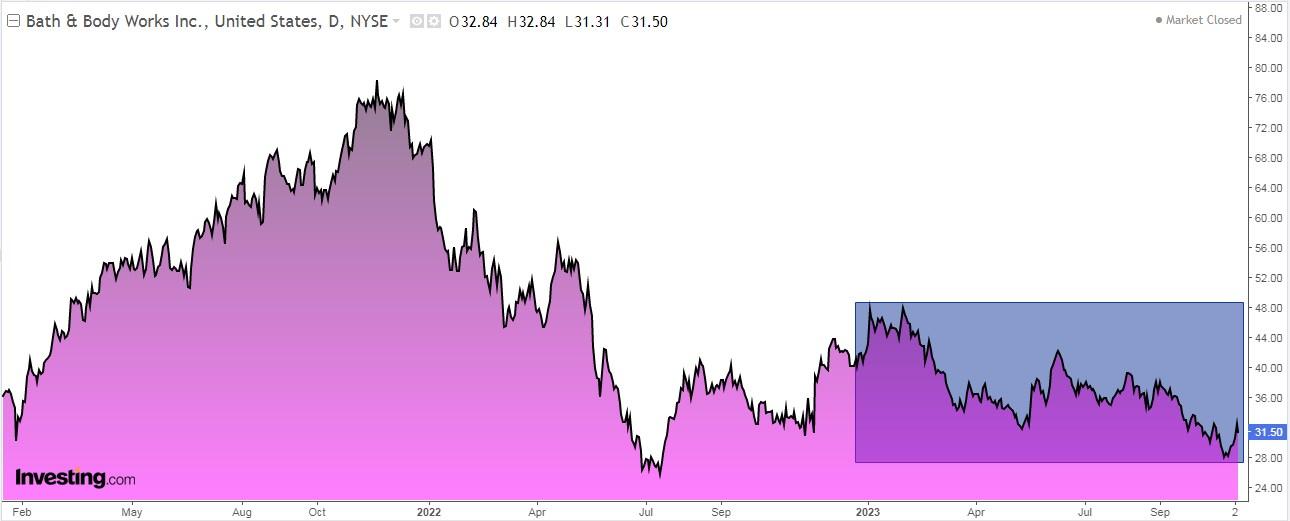
Bath and Body Works (NYSE:BBWI) specializes in home fragrances, body care, soaps, and disinfectant products.
The company was formerly known as L Brands and changed its name to Bath and Body Works in August 2021. It was founded in 1963 and is headquartered in Columbus, Ohio.
It distributes a dividend on December 1, specifically $0.20 per share, and shares must be held prior to November 16 in order to receive it. The annual dividend yield is +2.54%.

Source: InvestingPro
The latest results on August 23 showed an EPS increase of +20.2%. The next results date will be Nov. 16.

Source: InvestingPro
Its shares are up an average of +14.4% in the last 5 months of November.
It has 20 ratings, of which 12 are buy, 7 are hold and 1 is sell.
Over the last year, its shares are up +0.10%. The market gives it a potential at $47.16, while InvestingPro models put it at $46.64.

Source: InvestingPro
This article was originally published on this site


