5 Reasons this Bull Market is in the Early Innings
The first quarter of 2024 has come to a close, and stocks picked up where they left off last year – with bulls in control. Two major U.S. equity markets, the Nasdaq 100 ETF ((QQQ – Free Report) ) and the S&P 500 Index ETF ((SPY – Free Report) ), have each enjoyed 10% gains year-to-date. Despite much higher interest rates, a Regional Banking ((KRE – Free Report) ) scare, “stagflation” worries, and geopolitical escalations, the bull market is climbing the proverbial; “wall of worry,” leaving many flat-footed investors in a state of disbelief. Nevertheless, five data points suggest that one year from today, stocks are likely to be higher, including:
Power & Distance are Correlated
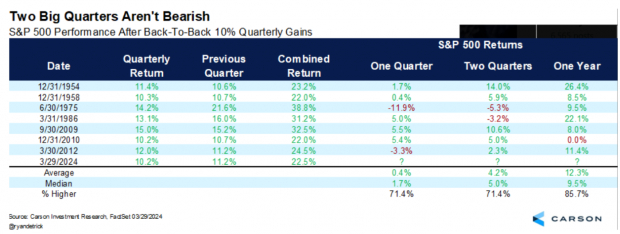
The S&P 500 Index just posted back-to-back quarters for only the eighth time since 1950. To put the impressive gains into perspective, the S&P 500 Index has averaged 10% for the entire year for the past thirty years. More importantly, what does such strength mean for investors? Luckily for us, Ryan Detrick of Carson Research ran the numbers. Judging by the historical data, bulls should feel confident. A year later, the S&P 500 Index is up 12.3% on average and has only been lower once in seven times (it lost less than a percent the one time it was lower).
Image Source: Carson Investment Research
Investors Have One Foot Out the Door
The National Association of Active Investment Managers Survey (NAAIM) measures the average exposure investment managers have to the market. Before last week’s pullback, exposure was over 100%. However, after a quick rug pull in the market, NAAIM plummeted to 84, a sign that investors have one foot out the door and sentiment is not overheated.
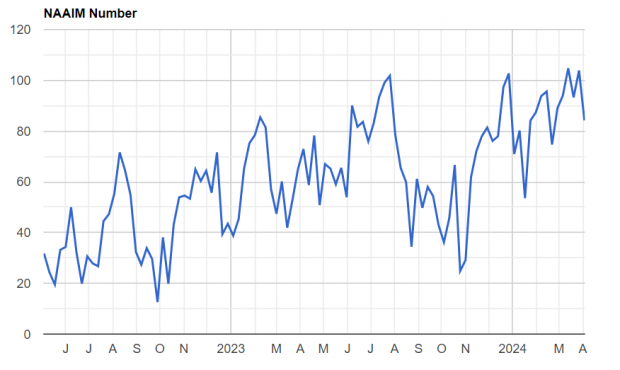
Image Source: NAAIM
Seasonality
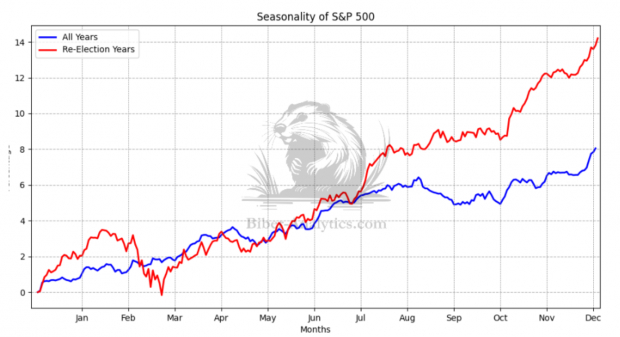
Election-year seasonality trends illustrate that presidential election years tend to be stronger than the average. Seasonality is worth emphasizing because it has been a surprisingly accurate indicator for investors for the past few years.
Image Source: Biber Analytics
The Bull Market has a Fundamental Foundation
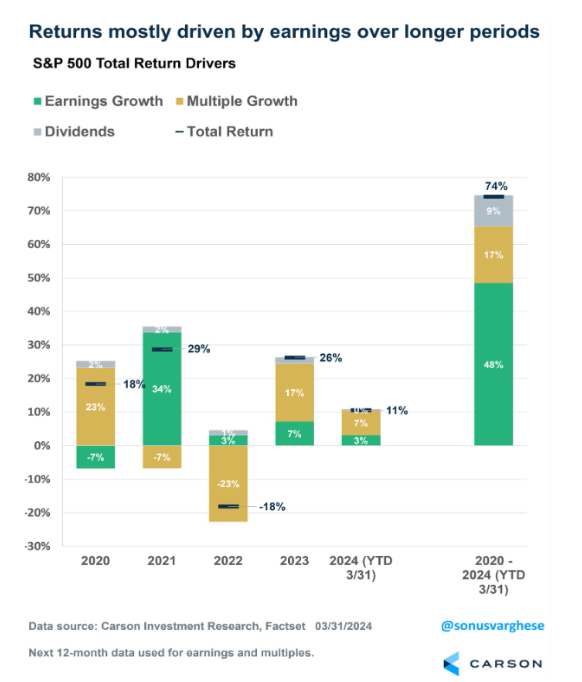
The S&P 500 is up 74% since January 2020. During this period, most of the gains are attributed to earnings and dividends, NOT multiple growth. The data acts as another argument against using P/E ratios in a vacuum – it’s impossible to know the denominator in the P/E ratio ahead of time.
Image Source: Carson Investment Research
Risk on Assets are Breaking Out
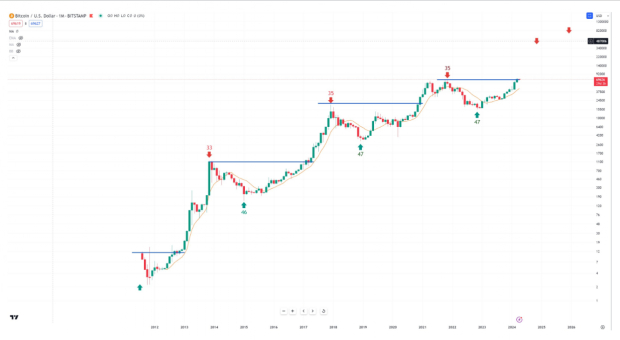
Bitcoin and crypto-related stocks likeCoinbase ((COIN – Free Report) ) and MicroStrategy ((MSTR – Free Report) ) have acted as a phenomenal “leading indicator” recently.That’s good news for bulls. The chart below shows that though Bitcoin is up quite a bit, the cycle is likely just starting, and a long runway awaits.
Image Source: TradingView
Bottom Line
Though the market has come a long way since the 2022 bear market, 5 data points suggest that the current bull market has a long way to run.
This article was originally published on this site


