These 5 Blue Chips Are Triggering Buy Signals
This article was originally published on this site
Earnings season charges on this month — and it’s leaving Wall Street a bit surprised.
So far, 215 of the stocks in the S&P 500 have reported their quarterly performance numbers to Wall Street. And of those, 78% have offered up profits that were biggest than analysts were expecting, on average.
It’s the biggest margin of positive earnings surprises we’ve seen in the last six quarters — and most sectors are reacting positively to the results.
But the market averages and aggregate earnings results don’t tell the whole story here.
That’s because they pull some of the focus away from the big trades that are setting up in some of Wall Street’s biggest stocks this earnings season. Contrary to what many investors may expect this fall, some of the most prominent blue chips on the market are teetering on the edge of breakout territory this week, including a couple of notable big names that have suffered post-earnings drops.
For a closer look at which big-name stocks you want to own here, we’re turning to the charts for a technical take on what the price action is saying about them — and when you should hit “buy.”
First, a quick note on the technical toolbox we’re using here: technical analysis is a study of the market itself. Since the market is ultimately the only mechanism that determines a stock’s price, technical analysis is a valuable tool even in the roughest of trading conditions. Technical charts are used every day by proprietary trading floors, Wall Street’s biggest financial firms, and individual investors to get an edge on the market. And research shows that skilled technical traders can bank gains as much as 90% of the time.
Every week, I take an in-depth look at big names that are telling important technical stories. Here’s this week’s look at five big stocks to trade.
Wells Fargo
A positive outlook for Wells Fargo (WFC) ? It’s true!
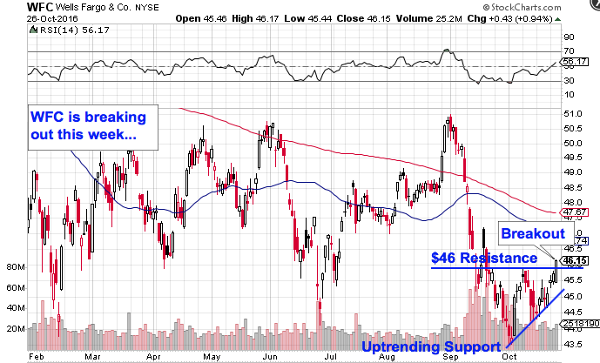
After plunging more than 10% in the last six weeks, Wells Fargo is finally showing some strength again this fall. Not to put too fine a point on it: Wells is breaking out this week. Here’s how to trade it.
Wells Fargo has spent the last few weeks forming an ascending triangle pattern, a bullish price setup that’s formed by horizontal resistance up above shares at $46, and uptrending support to the downside. Basically, as this giant bank has bounced in between those two technically important price levels, it’s been getting squeezed closer and closer to a breakout through that aforementioned $46 price level.
That breakout finally happened in yesterday’s trading session.
The price pattern in Wells Fargo isn’t exactly textbook. Typically, the ascending triangle pattern is a continuation setup that shows up after an up-move has already taken place, not a reversal pattern like we’re seeing here in Wells Fargo. But even if Wells’ price pattern isn’t textbook, it’s tradable — and that’s all that matters.
If you decide to buy this week’s breakout, consider parking a protective stop just below Wells Fargo’s most recent swing low at $44.50.
Kraft Heinz
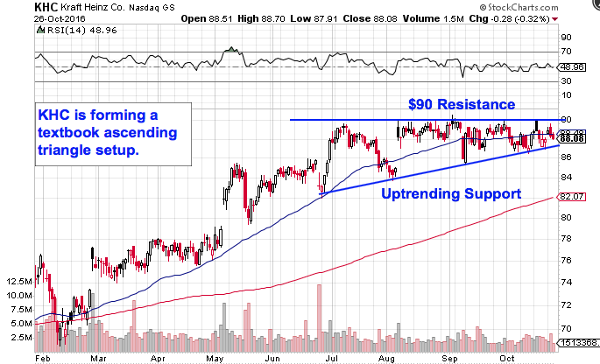
We’re seeing the same price setup in shares of $106 billion food giant Kraft Heinz (KHC) . The big difference here is that Kraft Heinz is showing off a textbook example of an ascending triangle pattern. The price setup is showing up this fall after shares have already climbed 21% higher year to date. The next buy signal for Kraft Heinz comes on a breakout above $90 resistance.
You might be wondering: what’s so special about the $90 level in particular?
The bottom line is that it all comes down to buyers and sellers in the marketplace. While the ascending triangle pattern on Kraft Heinz’s chart is a useful way to identify where to buy shares, simply drawing lines on a chart isn’t the thing that makes it tradable. Instead, the “why” for Kraft Heinz comes down to basic supply and demand for this stock’s shares themselves.
The $90 resistance level is a price where there has been an excess of supply of shares. In other words, it’s a spot where sellers have been more eager to step in and take gains than buyers have been to buy. That’s what makes a breakout above $90 so significant. The move means that buyers are finally strong enough to absorb all of the excess supply above that price level.
So, once Kraft Heinz manages to definitively move above $90, it’s time to join the buyers.
Coca-Cola
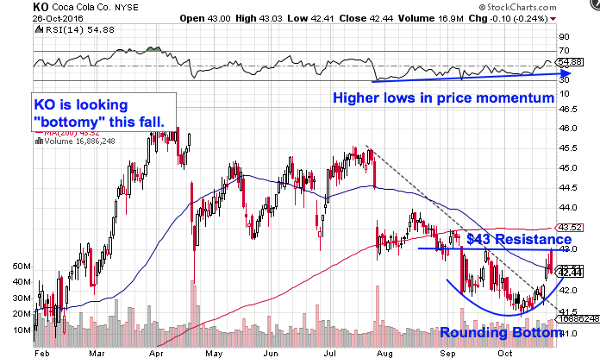
It’s been a rough few months for shares of beverage behemoth Coca-Cola (KO) . Since topping out at the start of April, this mega-cap has shed just over 9% of its market value at the exact same time that the rest of the S&P 500 has actually managed to push its way higher.
That’s the bad news. The good news is that Coke is finally looking “bottomy” this fall thanks to a simple price pattern.
Coke is currently forming a rounding bottom, a bullish reversal pattern that looks just like it sounds. The rounding bottom indicates a gradual shift in control of shares from sellers to buyers. It triggers a buy with a breakout through the resistance level that acts like a price ceiling over the course of the pattern. In Coca-Cola’s case, that price level to watch is resistance up at $43, a level that’s being tested this week.
Price momentum, measured by the 14-day Relative Strength Index up at the top of Coke’s chart, adds some extra evidence to the reversal that’s forming in shares. Our momentum gauge has made a series of higher lows at the same time Coca-Cola was carving out its rounding bottom, a bullish divergence that signals buying pressure has been building behind the scenes.
Once Coke breaks $43, buying shares becomes the high-probability trade.
Apple
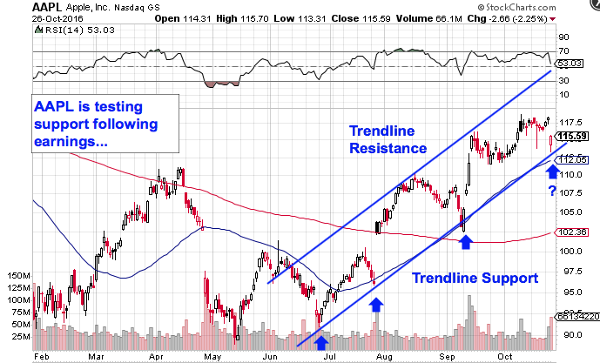
It’s been a challenging week for Apple (AAPL) .
On Tuesday, the tech giant reported earnings to Wall Street, and while the firm managed to post one of the highest nominal corporate profits in history for the quarter, it also disappointed investors by breaking a 15-year growth streak.
Before this week, Apple hadn’t posted an annual revenue decline since most folks were still using dial-up internet. But while shares dipped yesterday, investors who steer clear of Apple are making a mistake this month.
That’s because a streak in Apple’s stock price didn’t get broken yesterday, and it’s presenting a major buying opportunity for investors willing to pull the trigger.
Apple has spent the last several months forming an uptrending channel, a bullish price setup that’s about as simple as they get. Apple’s uptrend is formed by a pair of parallel, upward-sloping trend lines that have defined 99% of this stock’s price action since shares bottomed at the end of June. So far, every test of trend line support over that uptrend has provided a low-risk, high-reward buying opportunity in Apple. So, as shares touch that same support level for a fourth time here, it makes sense to buy the next bounce higher.
Waiting for that bounce is important for two key reasons: it’s the spot where shares have the most room to move up before they hit resistance, and it’s the spot where the risk is the least (because shares have the least room to move lower before the channel breaks, invalidating the upside trade).
Remember, all trend lines do eventually break, but by actually waiting for a bounce to happen first, you’re ensuring Apple can actually still catch a bid along that line before you put your money on shares.
If you decide to buy Apple here, it makes sense to park a stop on the other side of the 50-day moving average. That price line has been acting like a proxy for support since the end of the summer.
Starbucks
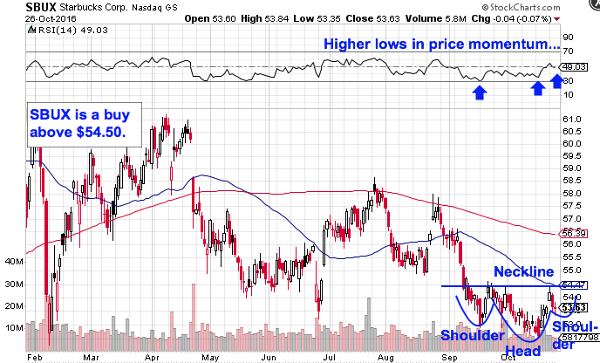
Last up on our list of big-cap breakout trades is Starbucks (SBUX) .
2016 has not been a banner year for this coffee chain. Shares are off more than 10% since the calendar flipped to January. But Starbucks is showing some light at the end of the tunnel for investors who’ve stuck it out. And, more importantly, it’s showing a big buying opportunity for investors who’ve been waiting on the sidelines for a buy signal.
Starbucks is currently forming an inverse head and shoulders pattern, a bullish reversal setup that signals exhaustion among sellers. The pattern is formed by two swing lows that bottom out at approximately the same level (the shoulders), separated by a lower low (the head). The buy signal comes on a move through Starbucks’ neckline up at $54.50. Shares are within grabbing distance of that breakout level this week.
Remember to be reactionary with Starbucks, or any of the other potential breakout trades on our list that haven’t crossed that threshold yet.
Technical analysis is a risk-management tool, not a crystal ball — and Starbucks doesn’t become a high-probability buy until shares can crack above the $54.50 price level. That said, shares are within grabbing distance of breakout territory this week. Keep a close eye on them.